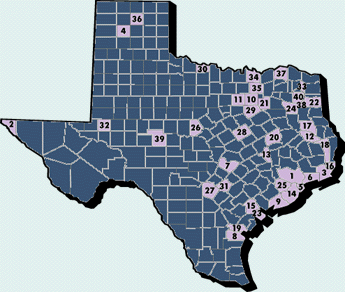
Texas Environmental Almanac Map Section
Toxic Transfers to Treatment and Disposal Facilities by Top 40 Counties, 1993 & 1992


| TOXIC TRANSFERS TO TREATMENT AND DISPOSAL FACILITIES BY TOP 40 COUNTIES, 1993 AND 1992 | ||||
|---|---|---|---|---|
| COUNTY | 1993 ON-SITE RELEASES (LBS) | POSITION | 1992 ON-SITE RELEASES (LBS) | POSITION |
| Harris | 31,873,169 | 1 | 30,845,067 | 1 |
| El Paso | 12,620,458 | 2 | 11,690,813 | 2 |
| Jefferson | 4,615,305 | 3 | 5,477,518 | 3 |
| Potter | 4,219,380 | 4 | 901,520 | 11 |
| Galveston | 2,228,817 | 5 | 2,561,929 | 5 |
| Chambers | 1,899,434 | 6 | 1,836,365 | 6 |
| Travis | 1,538,630 | 7 | 3,953,170 | 4 |
| Nueces | 1,447,177 | 8 | 386,532 | 14 |
| Matagorda | 1,250,966 | 9 | 1,609,291 | 7 |
| Dallas | 810,449 | 10 | 1,184,637 | 9 |
| Tarrant | 729,088 | 11 | 788,666 | 12 |
| Angelina | 535,991 | 12 | 1,126,647 | 10 |
| Brazos | 488,270 | 13 | 265,906 | 18 |
| Brazoria | 443,432 | 14 | 373,238 | 15 |
| Victoria | 431,349 | 15 | 39,517 | 42 |
| Orange | 429,863 | 16 | 1,453,188 | 8 |
| Nacogdoches | 360,705 | 17 | 118,188 | 26 |
| Jasper | 349,371 | 18 | 43,225 | 41 |
| San Patricio | 325,110 | 19 | 63,724 | 35 |
| Leon | 270,327 | 20 | 476,605 | 13 |
| Kaufman | 270,327 | 21 | 24,661 | 48 |
| Harrison | 197,037 | 22 | 282,335 | 16 |
| Calhoun | 181,505 | 23 | 97,867 | 28 |
| Smith | 176,184 | 24 | 179,856 | 23 |
| Fort Bend | 162,543 | 25 | 227,878 | 19 |
| Brown | 162,022 | 26 | 119,611 | 25 |
| Bexar | 134,642 | 27 | 126,932 | 24 |
| McLennan | 103,570 | 28 | 204,403 | 21 |
| Ellis | 98,540 | 29 | 63,797 | 34 |
| Wichita | 94,005 | 30 | 88,238 | 29 |
| Guadalupe | 90,545 | 31 | 182,455 | 22 |
| Ector | 86,004 | 32 | 18,588 | 49 |
| Morris | 83,052 | 33 | 99,480 | 27 |
| Grayson | 81,828 | 34 | 57,185 | 37 |
| Collin | 70,586 | 35 | 270,519 | 17 |
| Hutchinson | 67,000 | 36 | 28,260 | 46 |
| Lamar | 64,121 | 37 | 56,397 | 38 |
| Gregg | 53,101 | 38 | 61,917 | 36 |
| Tom Green | 30,000 | 39 | 86,500 | 31 |
| Upshur | 29,590 | 40 | 15,617 | 54 |
| Cumulative Total 99.48% | ||||
| Note: Figures do not include transfers to Publicly-owned Treatment Works, Off-site Recycling or Off-site Energy Recovery. | ||||
| Source: Information from Toxics Release Inventory Program, Office of Pollution Prevention, Texas Natural Resource Conservation Commission. | ||||


Please send questions, comments, or problems with this page to ltarver@mail.utexas.edu.