

Almanac Table of Contents | Chapter Six Table of Contents | TEC Home Page
NEXT PAGE * PREVIOUS PAGE Go to page 1*2*3*4*5*6*7*8*Notes

How these efforts will ultimately improve air quality is still unknown. The EPA says that 90 million Americans live in cities that are non-attainment for at least one of the six main air pollutants targeted by the Federal Clean Air Act.(18) In addition, there are possible global problems - such as ozone depletion and global warming - which may defy strictly national solutions. Other "air" issues, such as indoor air pollution, are not addressed by the Federal Clean Air Act at all.
Moreover, none of the changes mandated by the law come cheaply. Industries large and small will feel the effects of the Federal Clean Air Act. For example, in areas of the state not meeting ozone standards, tough new emission standards will require businesses to install expensive pollution control equipment. These businesses will also have to apply for new federal operating permits. In some sectors, such as electric utilities and petroleum refineries, these requirements have already led to some job losses. Even small businesses like dry cleaners, bakeries and printers will have to install new equipment to control emissions of volatile organic compounds and nitrogen oxides. Because the Federal Clean Air Act greatly expanded the scope of government regulation, the government's cost of monitoring and enforcing air-quality law has also increased.
These anticipated economic impacts were the main source of opposition to the bill. Still, the Act will create new markets for alternative fuels, pollution control equipment and new services, thus creating new jobs. And supporters believe that the economic value of the Act's public-health benefits - measured in fewer sick days, hospitalizations and deaths - will more than offset initial economic costs.
Source: Texas Natural Resource Conservation Commission, The Texas Environment (Spring 1994), 8.
With 18 million cars on its roads, 442 electric utility generators using gas, oil, coal and other sources of fuel, 60 percent of the nation's petrochemical production, 25 percent of the nation's refining capacity and a population of more than 18 million people, Texas must grapple with the full range of clean air issues. The state consistently ranks at or near the top of the list in air toxic emissions, reflective of the disproportionate amount of petrochemical production relative to the rest of the country. Half of the state's population lives in "non-attainment" cities, which do not meet federal standards for clean air.
This chapter discusses air quality in Texas, outlining the problems and summarizing the efforts to deal with it. It is divided into six sections:
The 1990 Federal Clean Air Acts set forth air quality standards for six pollutants: ozone (03), carbon monoxide (CO), sulfur dioxide (SO2), nitrogen dioxide (NO2), respirable particulate matter (PM10) and lead (Pb). The Environmental Protection Agency has determined an allowable limit for each of these pollutants that is intended to protect the public from exposure to dangerous levels. These national standards are known as the National Ambient Air Quality Standards (NAAQS).
One set of standards, called primary standards, is designed to protect human health. Another set, called secondary standards, is designed to protect the environment and limit property damage. Any area of a city that exceeds a standard causes the entire metropolitan area to be in violation. Since the EPA began regulating these pollutants, levels of all have declined. Most emissions have shown a modest decline. The exception is lead, which showed a sharp decline (90 percent) between 1982 and 1991. This dramatic reduction is due largely to the phase out of leaded gasoline which began in the 1970s. Today, the most abundant single pollutant is carbon monoxide, accounting for about 50 percent of total emissions by weight.
At monitoring stations around the state, the four gaseous criteria pollutants (NO2, SO2, CO, and O3) are monitored continuously, with one-hour averages measured each hour, every day. PM10 and lead are measured at least once every six days for a 24-hour averaging period, although some sites in Texas are monitored more frequently. The Texas Natural Resource Conservation Commission, local governmental agencies and some private organizations monitor for criteria pollutants (see box in text on monitoring).
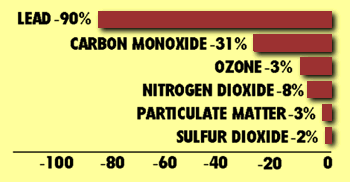
Source: Environmental Protection Agency, National Air Quality and Emissions Trends Report, 1991, (Washington, DC: EPA, October 1992).
| NATIONAL AMBIENT AIR QUALITY STANDARDS (NAAQS) | |||
|---|---|---|---|
| POLLUTANT | AVERAGING PERIOD | PRIMARY NAAQS | NOTES |
| Ozone | 1-Hour | 0.12 ppm* | 1 |
| Carbon Monoxide | 1-Hour 8-Hour | 35.00 ppm 9.00 ppm | 2 2 |
| Sulfur Dioxide | Annual 24-Hour | 0.03 ppm 0.14 ppm | 3 2 |
| Nitrogen Dioxide | Annual | 0.053 ppm | 3 |
| Respirable Particulate Matter | 24-Hour Annual | 150.00 mg/m3 50.00 mg/m3 | 1 3 |
| Lead | Quarter | 1.50 mg/m3 | 3 |
|
ppm = parts per million mg/m3 = micrograms per cubic meter 1. Not to be exceeded more than 3 days over 3 years. 2. Not to be exceeded more than once per calendar year. 3. Not to be exceeded. | |||
| *While the standard is 0.12 ppm for ozone, the EPA only records a violation if levels are above 0.125 ppm. | |||
| Source: Texas Air Control Board, Texas Air Control Board Fact Sheets: National Ambient Air Quality Standards (Austin: TACB, 1993), 3. | |||
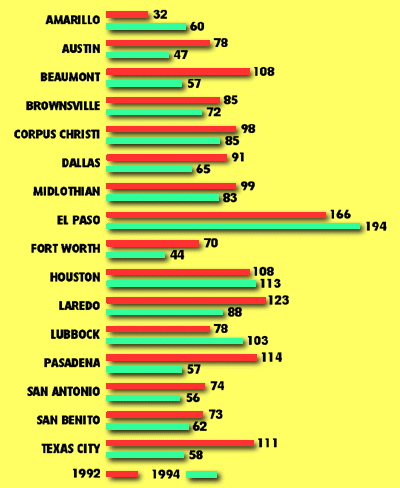
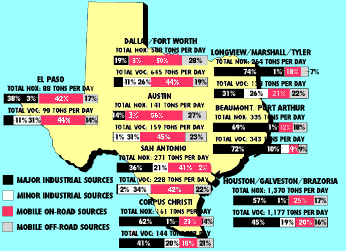 NITROGEN OXIDES AND VOLATILE ORGANIC COMPOUND EMISSIONS IN TEXAS' MAJOR METROPOLITAN AREAS, TONS PER DAY
In the upper atmosphere, ozone (O3), an oxygen molecule with three, rather than two, oxygen atoms, forms a layer that filters out ultraviolet radiation from the sun. Concern about the thinning of the atmospheric ozone layer has led to bans on the use of certain chemicals, such as chlorinated fluorocarbons, that may destroy ozone.
Though atmospheric ozone helps sustain life, ozone formed near the ground may adversely affect plants, animals and humans. Ozone is produced when reactive hydrocarbons known as volatile organic compounds (VOCs) combine with nitrogen oxides in the presence of sunlight. Ozone problems are most common in the hot summer months because the warm air and sunlight speed ozone formation.
Volatile organic compounds are emitted from a wide variety of sources. These include automobiles and other vehicles (referred to as "mobile sources" in the Federal Clean Air Act); refineries and chemical manufacturing plants ("major stationary sources"); paint shops and dry cleaners ("minor" or "area sources"); recreational boats, ships, barges, lawn and garden equipment, aircraft, and locomotives ("off-road mobile sources"); and plants and trees ("biogenics"). Yes, even trees contribute to VOCs (see box in text). Nitrogen oxide comes from some of the same sources - automobiles, boats, trains and planes, and refineries - as well as from service stations, home heating and cooling units, wastewater treatment plants, power plants and forest fires. The Texas Natural Resource Conservation Commission has estimated both the amount and the sources of VOCs and NOx released into the atmosphere in major Texas metropolitan areas.
Non-Attainment Areas.
Four metropolitan areas in Texas have exceeded the national standards for ozone often enough to be currently classified as non-attainment areas. They are: Houston/Galveston/Brazoria, Beaumont/Port Arthur, Dallas/Fort Worth and El Paso. The Houston/Galveston/Brazoria metropolitan area reports the highest numbers of days exceeding ozone standards in Texas. In general, Texas cities have shown a decline over the past 10 years in the number of days exceeding national standards. Other large Texas cities like Austin, San Antonio and Corpus Christi have met the ozone standard since the early 1980s. Still, in both 1993 and 1994, Corpus Christi exceeded the one-hour ozone standards on one occassion, and Austin and San Antonio approached it.
Health and Environmental Effects of Ozone.
High levels of ozone - including levels above the 0.125 parts per million standard - can have serious human health effects. Ozone reacts with lung tissue and can cause breathing problems. The risk of asthma may be increased and people may cough and have chest pains. For unknown reasons, about 10 to 20 percent of the population, sometimes referred to as "responders," is especially sensitive to high ozone concentrations. This group, along with people with pre-existing respiratory diseases and people who exercise outdoors, are particularly at risk from high ozone levels.(20)
Source: James Cannon, prepared for American Lung Association, The Health Costs of Air Pollution: A Survey of Studies Published 1984-1989 (New York: American Lung Association, 1990), 43.
High ground levels of ozone can also have negative environmental effects. It is believed to affect crop and forestry production by damaging the cell walls of plants. In 1987, the East Texas Intensive Research Site was established near Nacogdoches to investigate how pollutants affect the development of one- to four-year-old short leaf pines along coastal plains. The study subjected some trees to persistent exposure to ozone and the trees showed loss of needles, stunted growth and fewer stems.(21)
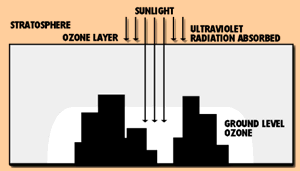
Ozone is formed in a photochemical reaction process. Other pollutants act on oxygen at the earth's surface on warm days and in the presence of ultraviolet radiation to produce ground level ozone.
Source: Texas Air Control Board, Air Quality in Texas: Twenty Years of Environmental Protection (Austin: TACB, 1992), 8.
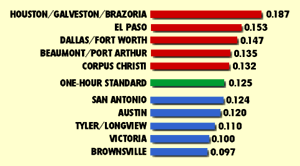
Source: Texas Natural Resource Conservation Commission, Data Management and Analysis Division, 1995
| DECREASING OZONE TRENDS, NUMBER OF DAYS EXCEEDING OZONE STANDARD, 1984 - 1994. | |||||||||||
|---|---|---|---|---|---|---|---|---|---|---|---|
| 1984 | 1985 | 1986 | 1987 | 1988 | 1989 | 1990 | 1991 | 1992 | 1993 | 1994 | |
| Dallas/Fort Worth | 19 | 18 | 11 | 11 | 9 | 4 | 7 | 7 | 4 | 4 | 9 |
| Tyler/Longview | 1 | 1 | 0 | 0 | 0 | 0 | 2 | 0 | 1 | 1 | 0 |
| El Paso | 8 | 10 | 11 | 12 | 6 | 10 | 4 | 5 | 5 | 4 | 6 |
| Beaumont/ Port Arthur | 13 | 0 | 8 | 3 | 7 | 9 | 5 | 9 | 5 | 0 | 2 |
|
Houston/Brazoria/ Galveston | 56 | 58 | 48 | 54 | 59 | 37 | 52 | 37 | 28 | 28 | 30 |
| San Antonio | 1 | 0 | 1 | 1 | 1 | 0 | 0 | 0 | 0 | 0 | 0 |
| Austin | 0 | 2 | 0 | 0 | 0 | 0 | 0 | 0 | 0 | 0 | 0 |
| Corpus Christi | 1 | 0 | 0 | 2 | 0 | 0 | 1 | 0 | 0 | 1 | 1 |
| Note: Totals include only state and local governmental ozone monitoring sites, not private networks. | |||||||||||
| Source: Texas Natural Resource Conservation Commission, Data Management and Analysis Division, 1995. | |||||||||||
| DO TREES POLLUTE? |
|---|
|
Do trees pollute? In the early 1980s, then-President Ronald Reagan and some noted scientists attracted attention when they confirmed that trees themselves are a possible source of some types of air pollution. Trees do contribute to the formation of ozone by releasing volatile organic compounds such as isoprene, monoterpene and alpha-pinene.
Under Title 1 of the Federal Clean Air Act, states are required to estimate how much trees and plants contribute to VOC production for those areas that exceed ozone standards. The sources of these VOCs, known collectively as "biogenics," include forests, crops, lawn grasses and other vegetation. The more vegetation an area has, the more these biogenics will contribute to overall VOC levels. For example, biogenics are estimated to account for 22 percent of all VOCs emitted in the woody Houston/Galveston area, but only 12 percent in the arid El Paso area.(19) Of course, biogenic sources are natural sources of air pollution and no one is suggesting that trees be cut to reduce pollution. In fact, the air quality benefits of biogenics far outweigh the costs since plants produce oxygen, filter the air and prevent erosion. Biogenic sources are not figured into the calculation of how much an area must reduce VOC emissions. |
| ESTIMATES OF THE POPULATIONS-AT-RISK EXPOSED TO ADVERSE HEALTH CONSEQUENCES IN OZONE NON-ATTAINMENT AREAS IN TEXAS | |||||
|---|---|---|---|---|---|
| AGE-SPECIFIC POPULATIONS | PEDIATRIC | ||||
| COUNTY | <13 | 65+ | ADULT ASTHMA* | ASTHMA | COPD** |
| Brazoria | 44,800 | 14,948 | 3,240 | 4,901 | 10,223 |
| Chambers | 4,582 | 1,903 | 344 | 512 | 1,104 |
| Collin | 60,752 | 13,769 | 4,407 | 6,768 | 13,524 |
| Dallas | 398,461 | 152,514 | 28,549 | 48,991 | 98,292 |
| Denton | 60,036 | 13,775 | 4,242 | 7,181 | 13,708 |
| El Paso | 148,885 | 48,267 | 11,106 | 14,416 | 31,634 |
| Fort Bend | 59,998 | 11,125 | 4,310 | 5,428 | 11,489 |
| Galveston | 47,515 | 22,771 | 3,450 | 5,712 | 12,046 |
| Hardin | 9,436 | 4,860 | 698 | 1,062 | 2,345 |
| Harris | 643,551 | 198,222 | 46,369 | 72,666 | 147,562 |
| Jefferson | 51,561 | 33,634 | 3,726 | 6,343 | 13,843 |
| Liberty | 12,022 | 6,192 | 887 | 1,356 | 2,980 |
| Montgomery | 42,414 | 15,693 | 3,116 | 4,647 | 9,904 |
| Orange | 17,981 | 8,740 | 1,325 | 2,091 | 4,527 |
| Tarrant | 257,220 | 97,424 | 18,289 | 30,784 | 62,214 |
| Victoria | 17,920 | 8,118 | 1,298 | 1,879 | 4,140 |
| Waller | 4,694 | 2,562 | 342 | 631 | 1,284 |
| *Pediatric asthma is calculated in the population less than 18 years of age. | |||||
| **COPD includes chronic bronchitis and emphysema. | |||||
| Source: American Lung Association, Breath in Danger II: Estimation of Populations-At-Risk of Adverse Health Consequences in Areas Not in Attainment With National Ambient Air Quality Standards of the Clean Air Act (New York: American Lung Association, 1993), Table 3. | |||||
Sulfur dioxide and nitrogen oxides are gases released when fossil fuels are burned. When these gases react with water in the atmosphere, sulfuric acid and nitric acids can form and fall as rain, commonly referred to as "acid" rain. In areas with little precipitation, the acids may become incorporated into dust and smoke and fall to the ground as "dry" acid.(22) Acid rain can harm or kill fish by making lakes and rivers more acidic, i.e. by lowering the pH. It can also damage buildings, stone and monuments as well as crops and forests. Studies indicate that acid rain can also reduce crop yields both by damaging foliage and by causing minerals to leach from the soil.(23) While adverse affects have been reported in the Northeast, no harmful effects have been documented in Texas. This is because of two factors: 1) the strongly alkaline soils characteristic of much of the state; and 2) the absence of a snow pack melt common in more northern states.
Both nitrogen oxide and sulfur dioxide have been linked to the formation of acid rain and acidic lakes. Pinpointing the cause of acid rain is difficult, primarily because of multiple emission sources and complex meteorology. Rain can become acidic as a result of water reacting with nitrogen oxides and sulfur dioxide. But other factors, such as acidic waste runoff and naturally high acidic levels in lakes or streams, may also contribute to acidity. In 1991, the Texas Air Control Board, later the TNRCC, and the federal government began monitoring the acidity (pH) of rain at 15 different sites. In general, the pH was lower - more acidic - in rainfall collected in East Texas.
Nitrogen oxides and sulfur dioxides have other harmful effects in addition to their ability to form acid rain deposition. At high levels, nitrogen oxides are known to cause lung damage and other respiratory illness, particularly in children and people suffering from asthma.(24) In Texas, nitrogen dioxide has never exceeded the national standard set in 1973. It does, however, contribute to the formation of ozone (see previous section).
High concentrations of sulfur dioxide in the air may cause difficulty in breathing and a choking sensation. Children, the elderly, asthma sufferers and people with chronic lung and heart disease are particularly susceptible to the adverse effects of sulfur dioxide.
Unlike nitrogen oxide - which is mainly the result of automobile and utility emissions - sulfur dioxide is emitted chiefly from industrial sources like power plants using sulfur-containing fuel, metallic-ore smelting facilities, wood and paper industrial processors and oil and gas refineries.
Sulfur dioxide levels in Texas vary across the state. The Houston/Galveston/Texas City area, the Beaumont/Port Arthur area, and the El Paso metropolitan area have shown the highest levels of SO2 measured in the state.(25) While most areas in the state do not exceed or even approach the air quality standards for SO2, tests conducted between 1985 and 1989 by the Houston Regional Monitoring Network, a private organization, showed sulfur dioxide levels in excess of national standards 13 times in the industrial district of the Houston Ship Channel.(26) Cooperative action between local industries, the TNRCC and the EPA has resulted in a voluntary reduction in SO2 emissions in the local area and no violations have been recorded since 1990.
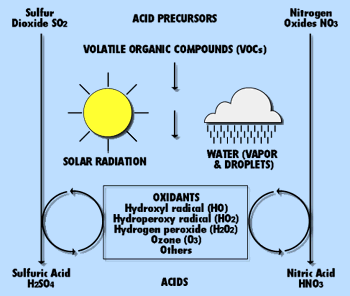
A coupled chemical system: acid precursor gases are transformed into acids.
Source: National Acid Rain Precipitation Assessment Program, Annual Report 1984 to the President and Congress.
| ACID RAIN SITES MONITORED IN 1991 | ||||
|---|---|---|---|---|
| SITE | AVE. pH | MAX. pH | MIN. pH | NO. OF SAMPLES |
| Longview | 4.81 | 7.41 | 3.63 | 361 |
| Austin | 5.00 | 5.56 | 4.45 | 14 |
| Forest Seed | 5.10 | 7.35 | 3.95 | 360 |
| Huntsville | 4.76 | 5.60 | 4.18 | 31 |
| Tyler | 4.87 | 5.08 | 4.47 | 3 |
| Houston | 5.07 | 5.38 | 4.62 | 14 |
| Attwater | 5.28 | 7.90 | 3.86 | 252 |
| Throckmorton | 5.65 | 8.00 | 3.94 | 217 |
| LBJ | 5.53 | 7.69 | 4.07 | 271 |
| Beaumont | 4.93 | 5.03 | 4.81 | 5 |
| Beeville | 5.60 | 7.85 | 4.07 | 249 |
| Muleshoe | 5.78 | 7.92 | 4.18 | 154 |
| Sonora | 5.73 | 7.23 | 3.69 | 214 |
| Big Bend | 5.98 | 7.86 | 4.45 | 290 |
| Guadalupe | 5.62 | 8.01 | 4.19 | 204 |
| Note: A pH of 7 is neutral. Higher numbers on the pH scale correspond to higher alkalinity, and lower numbers to increasing acidity. Unpolluted rainwater has a pH of 5.6, which is slightly acidic. | ||||
| Source: National Atmospheric Deposition Program and National Trends Network Texas Data and TNRCC Acid Rain Monitoring Network Field Monitoring Data, 1993. | ||||
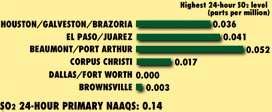
Source: Texas Natural Resource Conservation Commission, Data Management and Analysis Division, 1995.
| EXCEEDENCES OF 24-HOUR SO2 STANDARD MEASURED BY TEXAS AIR CONTROL BOARD, 1975 - 1993 | ||
|---|---|---|
| CITIES EXCEEDING STANDARD | HIGHEST VALUE RECORDED | # OF EXCEEDENCES |
| Beaumont/Port Arthur | .188 (1982) | 1 |
| El Paso | .147 (1982) | 1 |
| Beaumont/Port Arthur | .154 (1984) | 1 |
| Houston/Galveston/Texas City | .173 (1985) | 2 |
| Beaumont/Port Arthur | .324 (1989) | 2 |
| Standard: .14 parts per million | ||
| Source: Texas Natural Resource Conservation Commission, Data Management and Analysis Section | ||
A colorless, odorless gas, carbon monoxide results from the incomplete combustion of fossil fuels, most often in motor vehicles and power plants. Carbon monoxide can interfere with the blood's ability to carry oxygen to the heart, brain and other tissues. People with heart disease and unborn or newborn children are especially susceptible to carbon monoxide poisoning.(27) The area in Texas where the highest levels of CO are measured is El Paso, but even here, the NAAQS has not been exceeded more than 10 times per year. Carbon monoxide has also been identified as a possible precursor to the formation of ozone.(28)
Unlike ozone, carbon monoxide levels usually rise with colder weather, when atmospheric conditions are more stable. In Texas, only El Paso has consistently exceeded the eight-hour standard for carbon monoxide concentrations. Most notably, however, levels measured in recent years are lower than those measured ten years ago. Dallas exceeded standards twice in 1985, while Houston exceeded standards nine times between 1974 and 1986. No other exceedences in these two cities have since been recorded due to state and federal efforts to control carbon monoxide emissions. According to the 1990 EPA data base, El Paso ranked 5th in the nation, behind Steubenville, Ohio; Provo, Utah; Los Angeles, California; and Las Vegas, Nevada for levels of eight-hour concentrations of carbon monoxide.(29) However, 1994 data places El Paso behind eleven other U.S. cities.(30)
El Paso is a special case because it shares a common airshed with Ciudad Juárez, Mexico and is affected by that city's air pollution. A special section later in this chapter - "Sharing Air Along the U.S. - Mexico Border" - highlights some of these issues. In Texas, the levels and sources of carbon monoxide vary by location.
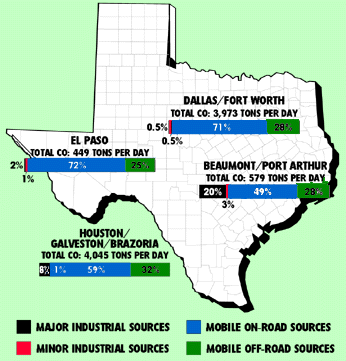 1990 CARBON MONOXIDE EMISSIONS BY MAJOR SOURCE CATEGORY IN MAJOR TEXAS CITIES
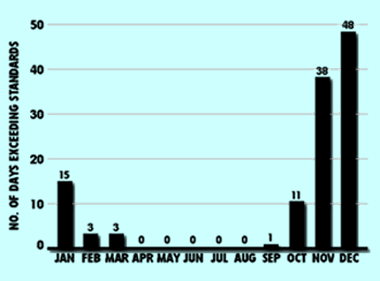
Seasonal variation of carbon monoxide in El Paso shows pollution highest in winter months.
Source: Texas Air Control Board, Air Quality in Texas: 1992 and Beyond, (Austin: TACB, 1992), 6.
| EL PASO 8-HOUR CARBON MONOXIDE TREND, BY NUMBER OF EXCEEDENCES IN DAYS AND HIGHEST 8-HOUR LEVELS. | ||
|---|---|---|
| HIGHEST LEVEL | EXCEEDENCES | |
| 1973 | 6.7 | 0 |
| 1974 | 11.7 | 1 |
| 1975 | 9.1 | 0 |
| 1976 | 13.5 | 6 |
| 1977 | 10.3 | 2 |
| 1978 | 11.0 | 2 |
| 1979 | 16.4 | 3 |
| 1980 | 12.1 | 7 |
| 1981 | 15.7 | 12 |
| 1982 | 14.2 | 8 |
| 1983 | 13.7 | 9 |
| 1984 | 15.4 | 9 |
| 1985 | 14.0 | 10 |
| 1986 | 15.2 | 12 |
| 1987 | 16.7 | 9 |
| 1988 | 12.1 | 6 |
| 1989 | 13.6 | 10 |
| 1990 | 15.2 | 8 |
| 1991 | 10.7 | 4 |
| 1992 | 10.5 | 3 |
| 1993 | 10.7 | 2 |
| 1994 | 9.8 | 1 |
| Source: Texas Air Control Board, Texas Air Control Board Fact Sheet: Ambient Air Quality in the El Paso Metropolitan Area (Austin: TACB, 1993), 2. | ||
| ESTIMATES OF THE POPULATIONS-AT-RISK EXPOSED TO ADVERSE HEALTH CONSEQUENCES IN CARBON MONOXIDE NON-ATTAINMENT AREAS, 1992 | |||
|---|---|---|---|
| AFFECTED AREA | PREGNANT WOMEN | CORONARY HEART DISEASE | |
| El Paso County | 11,793 | 19,181 | |
| Source: American Lung Association, Breath in Danger II: Estimations of Populations-At-Risk of Adverse Health Consequences in Areas Not in Attainment with National Ambient Air Quality Standards of the Clean Air Act (New York, NY: American Lung Association, 1993), 22. | |||
The category of air pollutant called "respirable particulate matter" includes liquids, hydrocarbons, soots, dusts, acids from aerosols and smoke particles that are smaller than 10 microns in diameter. This 10-micron size limit has led to the abbreviation of respirable particulate matter as "PM 10." These tiny particles make up about 55 percent of the total mass of suspended particles in air pollution, and come from the burning of fuels by industry, power plants and motor vehicles; from refuse incinerators; from dust created by construction, agriculture and unpaved roads; and from natural sources such as wind erosion.
While the nose can filter out larger particulates, PM10 can penetrate deep into the lungs. The further a particle penetrates and the higher the concentration, the more likely it is to cause wheezing, nose and throat irritation, bronchitis and lung damage. Chemicals such as toxic compounds attached to PM10 emissions can increase the potential for adverse effects. Groups at high risk include children, the elderly and people with pre-existing respiratory conditions like asthma and emphysema. Beyond these health hazards, PM10 reduces visibility and can discolor clothing and property.
In 1987, the Environmental Protection Agency revised its air quality standards for PM10, allowing a maximum of 150 micrograms per cubic meter on a 24-hour basis, or 50 micrograms per cubic meter as an annual average. Previously, the EPA had no specific standard for PM10, instead relying on a standard for all particulate matter, including particulate matter larger than 10 microns. The EPA estimates that adherence to these new standards will save 3,600 lives, reduce lost work days by 190,000 days and "reduced-activity" days, when people work less efficiently because of ill health, by 910,000 days.(31)
Still there has been considerable debate about whether these levels adequately safeguard human health and some studies have suggested that standards should be strengthened.(32) A recent study, which controlled for the effects of smoking, found that mortality risks are more strongly associated with concentrations of respirable particles and sulfates - the combination of sulfur dioxide with air - than with other common air pollution problems such as ozone or sulfur dioxide.(33)
Source: C. Arden Pope III, Micheal Thun, Mohan Namboodiri, Douglas Dockery, John Evans, Frank Speizer and Clark Heath, Jr., "Particulate Air Pollution as a Predictor of Mortality in a Prospective Study of U.S. Adults," American Journal of Respiratory Critical Care Medicine, Vol. 151 (1995): 669 - 674.
While the EPA is currently reviewing the Federal PM10 standard, some states have already adopted a more stringent standard. For example, the state of California, after reviewing studies on morbidity and mortality from PM10 exposure, adopted a state air-quality standard for particulate matter of 50 micrograms over 24 hours.
In Texas, only El Paso County has repeatedly exceeded both the 24-hour and annual standards set in 1987 for PM10. Other areas have occasionally exceeded this standard. In 1992, there were two exceedences out of 337 samples in El Paso. In 1993, there were none, while in 1994, there were two exceedences.(34) In El Paso, particulate matter levels rise during winter months, due mainly to combustion of wood and other fuels for heating.
El Paso is also impacted by particulate matter drifting from Ciudad Juárez in Mexico. Common sources of this particulate matter include unpaved roads and industrial combustion processes such as the incineration of garbage, including tires, without adequate controls. However, without adequate emissions inventories and ambient air quality monitoring in Ciudad Juarez to record air quality over time, it is difficult to determine if emissions are going down. TNRCC, the Environmental Defense Fund and others are working with Mexican environmental officials to address these needs.
Source: Texas Natural Resource Conservation Commission, Data Management and Analysis.
| NUMBER OF 24-HOUR EXCEEDENCES OF PARTICULATE MATTER PER LOCATION, 1986-1994 | ||
|---|---|---|
| EXCEEDENCES | # OF DAYS SAMPLED AT LOCATION OF EXCEEDENCE | |
| 1986 | ||
| El Paso-A | 8 | 291 |
| El Paso-B | 1 | 164 |
| Lubbock | 1 | 150 |
| 1987 | ||
| El Paso | 2 | 211 |
| Houston | 2 | 286 |
| 1988 | ||
| El Paso-A | 12 | 311 |
| El Paso-B | 4 | 40 |
| Lubbock | 1 | 164 |
| 1989 | ||
| El Paso-A | 7 | 328 |
| El Paso-B | 4 | 165 |
| Lubbock | 1 | 164 |
| 1990 | ||
| El Paso-A | 4 | 328 |
| El Paso-B | 2 | 160 |
| 1991 | ||
| El Paso | 1 | 336 |
| 1992 | ||
| El Paso | 2 | 337 |
| 1993 | ||
| None | ||
| 1994 | ||
| El Paso | 2 | 329 |
| Source: Texas Natural Resource Conservation Commission, Data Management and Analysis. | ||
| ESTIMATED POPULATION AT-RISK IN TEXAS COUNTIES WHICH EXCEEDED FEDERAL STANDARD (150 mg/m3) FOR RESPIRABLE PARTICULATE MATTER IN 1992 | |||
|---|---|---|---|
| PM10 VALUE | CHILDREN | OVER 65 | |
| El Paso | 158 | 138,961 | 61,933 |
| PEDIATRIC ASTHMA | ADULT ASTHMA | CHRONIC BRONCHITIS AND EMPHYSEMA | |
| El Paso | 10,988 | 18,261 | 32,911 |
| Source: American Lung Association, The Perils of Particulates, (New York: American Lung Association, 1994), 15. | |||
| POPULATION IN TEXAS COUNTIES WHICH WOULD BE CONSIDERED AT-RISK OF CALIFORNIA'S STANDARD (50 mg/m3) FOR RESPIRABLE PARTICULATE MATTER, 1992 | |||||||
|---|---|---|---|---|---|---|---|
| AGE SPECIFIC POPULATIONS | |||||||
| COUNTY | PM10 VALUE | 1991 TOTAL POPULATION | < 13 | 65+ | PEDIATRIC ASTHMA* | ADULT ASTHMA | COPD** |
| Cameron | 62 | 268,837 | 61,054 | 27,211 | 4,828 | 8,023 | 14,460 |
| Dallas | 61 | 1,886,962 | 428,534 | 190,991 | 33,886 | 56,315 | 101,491 |
| El Paso | 158 | 611,888 | 138,961 | 61,933 | 10,988 | 18,261 | 32,911 |
| Ellis | 92 | 86,622 | 19,672 | 8,768 | 1,556 | 2,585 | 4,659 |
| Galveston | 64 | 222,894 | 50,620 | 22,560 | 4,003 | 6,652 | 11,988 |
| Harris | 102 | 2,905,051 | 659,744 | 294,038 | 52,168 | 86,700 | 156,250 |
| Lubbock | 58 | 224,538 | 50,993 | 22,727 | 4,032 | 6,701 | 12,077 |
| Nueces | 60 | 296,847 | 67,415 | 30,046 | 5,331 | 8,859 | 15,965 |
| Tarrant | 64 | 1,200,416 | 272,617 | 121,502 | 21,557 | 35,826 | 64,565 |
| Webb | 58 | 139,830 | 31,756 | 14,153 | 2,511 | 4,173 | 7,521 |
| Totals | 7,843,885 | 1,781,365 | 793,928 | 140,859 | 234,096 | 421,886 | |
| *Pediatric asthma is calculated in the population less than 18 years of age. | |||||||
| **COPD includes chronic bronchitis and emphysema. | |||||||
| Source: American Lung Association, The Perils of Particulates, (New York: American Lung Association, 1994), 15. | |||||||
Between 1982 and 1991, air emissions of lead in the United States were reduced from 52,000 to 5,000 tons per year, largely as a result of the country's phase-out of leaded gasoline.(35) Nevertheless, lead continues to pose a public health threat, in part because of its persistence in the environment. Lead poisoning can lead to retardation in cognitive development in children, reduce mental ability and damage nerves and organs like livers and kidneys. It also may interfere with the creation of blood and raise blood pressure, leading to cardiovascular disease.(36) Because lead accumulates in the body organs, bones and blood, even chronic exposure to small amounts can be harmful to both human and animal life. Besides leaded gasoline, sources of lead pollution in the air include metal smelters and the manufacture and reclamation of lead batteries. Children and pregnant women are most at risk from exposure to high lead levels.(37)
In Texas, outside air pollution from lead is now limited to a handful of areas. In the Dallas-Fort Worth area, citizens were concerned about the number of lead smelters and battery plants in the area, but most of these facilities were shut down in the mid-1980s. Suspected health problems from exposure to high lead levels continue to concern Dallas-area residents. However, monitors show no exceedences at this time. In the city of Frisco in Collin County, ambient air levels of lead have exceeded national standards in an area of approximately one-half mile near a major battery plant. However, the last exceedences for lead national standards were in 1987.(38) Although lead exposure concerns had been raised over a 1.5-mile square surrounding an old battery reclamation plant in San Antonio, the site is currently designated as "unclassified" by the EPA until further monitoring can confirm the levels of lead in the air.
In the early and mid-1980s, several monitoring sites in the city of El Paso violated national standards for lead. However, the closing of a lead smelter plant in 1985 and the phase-out of leaded gasoline have brought levels in El Paso to within the allowable limit since 1986. Generally speaking, lead is not a big problem in ambient air in Texas. Thus, there is a greater potential for lead exposure in individual households because of the possible presence of peeling lead-based paint.
| HIGHEST LEAD QUARTERLY AVERAGES, 1993 AND 1994 | ||
|---|---|---|
| (Ambient lead levels in mg/m3) | ||
| 1993 | 1994 | |
| Frisco | 0.99 | 0.58 |
| Dallas | 0.14 | 0.08 |
| Midlothian | 0.36 | 0.25 |
| El Paso | 0.23 | 0.14 |
| Houston | 0.13 | 0.02 |
| Lead National Standard: 1.5 ug/m3 | ||
| Source: Texas Natural Resource Conservation Commission, Data Management and Analysis Division. | ||
| AIR QUALITY MONITORING: HOW MUCH DO WE KNOW? |
|---|
|
If you can't always see it, taste it, or maybe even smell it, how do you know air pollution is there? Texas' extensive monitoring network strives to answer that question by measuring concentrations of ambient air pollutants. The Texas Natural Resource Conservation Commission operates more than 80 permanent monitoring sites located across the state. In addition, six local governmental entities and four private organizations monitor the six criteria pollutants at other stations in an effort to pinpoint local problems. Many of these stations also monitor air toxics.
Despite the presence of these monitors in the major metropolitan areas, federal requirements and citizen concern about the health effects of toxics are generating a demand for more and better air-quality monitoring. The Texas Natural Resource Conservation Commission has invested about $1.5 million a year since 1992 to expand and operate its air toxics monitoring network. The agency plans to add 29 new toxic air monitoring stations by the end of 1995. Despite the large volume of toxics released each year into the air by Texas industries, ambient air toxics monitoring by the Texas Natural Resource Conservation Commission has not identified them as a significant public health risk.(39) Air toxics selected for monitoring were those emitted in the largest quantities from multiple sources. While it is not possible to monitor for all chemical compounds emitted, the results of monitoring currently conducted are considered indicative of broad-based public exposure to other compounds by the TNRCC. Some monitoring methods collect average samples of toxics, and thus, higher peak concentrations would not be quantified, although they would be represented as part of the average itself.(40) To complement its monitoring system, the TNRCC is investing in a more complete toxics monitoring network and expanding its use of mobile monitoring equipment, which includes a self-contained mobile laboratory, sampling vans and an air toxics response trailer.(41) |

NEXT PAGE * PREVIOUS PAGE Go to page 1*2*3*4*5*6*7*8*Notes

Please send questions, comments, or problems with this page to ltarver@mail.utexas.edu.