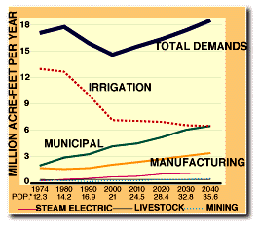


Between 1930 and 1980, statewide water use increased more than five-fold, from 3 million to about 18 million acre-feet per year. Over the same period, the population more than doubled, growing from 5.8 million to 14.2 million.(34) Between 1980 and 1990, however, statewide water use actually declined, largely because the number of irrigated acres declined and more efficient irrigation practices were adopted. With the exception of irrigation, which is expected to continue declining, all of the major use categories are likely to increase, according to the 1990 Water for Texas plan.(35)
Water use by Texas cities is expected to nearly match irrigation use as the major consumer of water by 2040. The use of water for irrigation reached its peak in the early 1980s. Since then both the number of irrigated acres and the amount of water used per acre have declined rapidly and will likely continue to do so.
Of the nearly 16 million acre-feet of water Texas consumed in 1990, groundwater supplied about 8.9 million acre-feet, or about 56 percent, and surface water provided the remaining 6.9 million acre-feet, or 44 percent.39 Almost 95 percent of the groundwater came from nine major aquifers; the remaining five percent was drawn from 20 minor aquifers.(40)
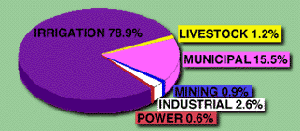
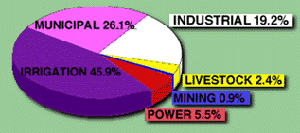
The consumption pattern for water pumped from the ground is different than the pattern for water taken from rivers and reservoirs. In 1990, some 79 percent of groundwater was consumed by irrigation and only 16 percent was used by municipalities.(41) For surface water, municipalities used 26 percent and irrigation used up 46 percent. Industry relies mainly on surface water for its water needs, making up 16 percent of total surface water use in 1990.(42)
The share of water demands met by groundwater and surface water has changed over time. Groundwater use has dropped from 70 percent of all water used in 1974 to 55 percent in 1991. In absolute terms, the state's consumption of groundwater has gone from more than 12 million acre-feet to about nine million acre-feet in 11 years. Reliance on groundwater should continue to decline for two reasons. First, the decline of agricultural acreage overall has reduced the number of irrigated acres in the state, and the acres dropped were almost all irrigated by groundwater. Second, many of the large metropolitan areas are converting to surface water or mixing groundwater with surface water.(43) For example, Houston is gradually switching from underground sources because of subsidence problems, while El Paso is switching because of the increasing elevated salinity - and declining quality - of its groundwater resources. Though this trend is expected to continue, groundwater will nevertheless continue to supply most of the water for large, arid areas of the state.(44)

The demand shown from 2000 to 2040 is the Texas Water Development Board's high-case scenario with conservation - more efficient use of water - which assumes relatively high economic and population growth, phased-in conservation for municipal water use reaching 15 percent savings by 2020 and better water use efficiency for both agricultural and industrial production.
*Polulation in millions.
| THE "MINING" OF AQUIFERS |
|---|
| The term "mining," when used in connection with an aquifer, refers to the practice of pumping more water from the aquifer than will be replaced through the natural recharge process. In some areas of Texas, mining of major aquifers has caused subsidence of the land. In other areas, mining has affected water quality by allowing the saline water that lies deep in most aquifers to encroach on the layers of water nearer the surface, which are used by humans. The aquifers most affected by mining include the Ogallala Aquifer in the High Plains; the Carrizo-Wilcox Aquifer in the Cypress Creek river basin; the Trinity Aquifer in Dallas and Tarrant Counties; and the Gulf Coast Aquifer in the Houston-Galveston region and the Baytown, Freeport and San Jacinto River Basin areas. Potential saline encroachment problems and subsidence due to declining aquifer pressure are also present in the Trinity Aquifer in Hill, McLennan, Falls and Bell counties and all along the Gulf Coast Aquifer. The Edwards Aquifer has suffered saline-encroachment and subsidence problems, and several springs fed by the aquifer are drying up. Finally, mining of the Hueco Bolson near El Paso has changed groundwater flow and reduced the quality of the water as saline water from adjacent saline bearing sands encroaches upon higher quality groundwater.(33) |
The current Texas state water plan, Water for Texas, was developed in 1990 and updated in 1992. A new plan is being developed for release in 1996. In 1990, the Texas Water Development Board projected that the state's population would grow from 17.5 million in 1990 to 35.6 million by 2040.(47) This doubling of the population will increase municipal water needs by about 72 percent, even with significant water conservation, according to the Board. Over the same period, irrigation needs are projected to decrease by nearly 25 percent.(48) The largest increase in demand is expected to occur in the industrial sector. Manufacturing use is projected to increase by about 120 percent, from 1.56 to 3.44 million acre-feet, by 2040.(49)
There are some uncertainties in these demand projections. The Texas Water Development Board's most likely estimate of demand in the 1990 Water Plan assumes a high population growth and high economic development coupled with 15 percent conservation. However, in some areas conservation could probably reach much higher levels, while in those areas which have already achieved high conservation levels, such additional reductions may not be possible. Conservation may become a much greater factor in industry and municipal water use as water prices continue to rise.

The Texas Water Development Board Water Plan projections are also based on the assumption that industrial water use will rise in correspondence with increases in industrial productivity, which has not been the case historically. In fact, even though productivity increased in the 1980s, water use in manufacturing only increased by 150,000 acre-feet between 1984 and 1990. In fact, water use within industries varies considerably according to geography and use of conservation techniques, and not just according to the amount of production. For example, in the petroleum refining industry, refineries in the Corpus Christi area and West Texas use only half as much water per barrel of refined oil as do the refineries along the upper Gulf Coast from Beaumont to Houston.(50)
A comparison of state water plans over the years illustrates how substantially projections can vary. The Texas Water Development Board's projected demands for the year 2000 are about 8 million acre-feet higher in the 1984 Water Plan than they are in the 1990 Water Plan.(51) Two factors account for the differences in these forecasts. The 1990 plan forecast a lower amount for irrigation, based on reductions in this use during the 1980s. The 1990 plan also showed a smaller population and economic base than the 1984 plan, reflecting the economic decline of the later 1980s.(52)

The Texas Water Development Board has been working with the Texas Natural Resource Conservation Commission and the Texas Parks and Wildlife Department to develop a "consensus" 1996 water plan based upon more carefully projected demands. In conjunction with the Texas Natural Resource Conservation Commission and the Texas Parks and Wildlife Department, the Texas Water Development Board has released demand projections for the 1996 Consensus Water Plan. Two fundamental differences between demand projections in the previous water plans and the 1996 plan are: (1) the water conservation effects vary from city to city; and (2) the conservation effects are more aggressive (greater) than in previous plans. Assuming average rainfall, some conservation and the most likely population growth scenario, these projections show total demands only increasing from 15.8 million acre-feet to 16.8 million acre-feet over the 50 year period.(53)
| IRRIGATION FOR AGRICULTURE |
|---|
| Irrigation accounted for 65 percent of the water used in Texas in 1990. Of this amount, 90 percent was used to irrigate cotton, wheat, grain, sorghum, corn, hay and rice.(36) Some crops used water more intensely than others. In recent years, however, irrigation's share of total water use has declined significantly and the trend is expected to continue. From 1980 to 1990, annual water use for irrigation declined from 12.7 million acre-feet to 10.2 million acre-feet - about 20 percent. This decline is expected to continue over the next 50 years, with projected agricultural use in 2040 of between 6.5 million and 8 million acre-feet per year, depending upon conservation and projection methods.(37) There are two reasons for both the present and the expected future decline: 1) the number of irrigated acres in production dropped 30 percent between 1975 and 1990; 2) farmers are practicing better water conservation techniques. The decline in irrigated lands is continuing. Since 1985, the Texas Water Development Board has helped promote conservation by approving nearly $1 million in grants and $10 million in loans for agricultural water conservation projects.(38) |


Please send questions, comments, or problems with this page to ltarver@mail.utexas.edu..